



India’s Growth Paradox: Strong GDP Projections—But Who Is Actually Benefiting?
- BY Subhashis Banerji
- October 18, 2026
- 0 Comments
- 45 Views
Reading Time: 31 minutes
Contents
hide
1
India’s Growth Paradox: Strong GDP Projections—But Who Is Actually Benefiting?
1.18
A Practical Blueprint for Inclusive Economic Growth
India’s Growth Paradox: Strong GDP Projections—But Who Is Actually Benefiting?
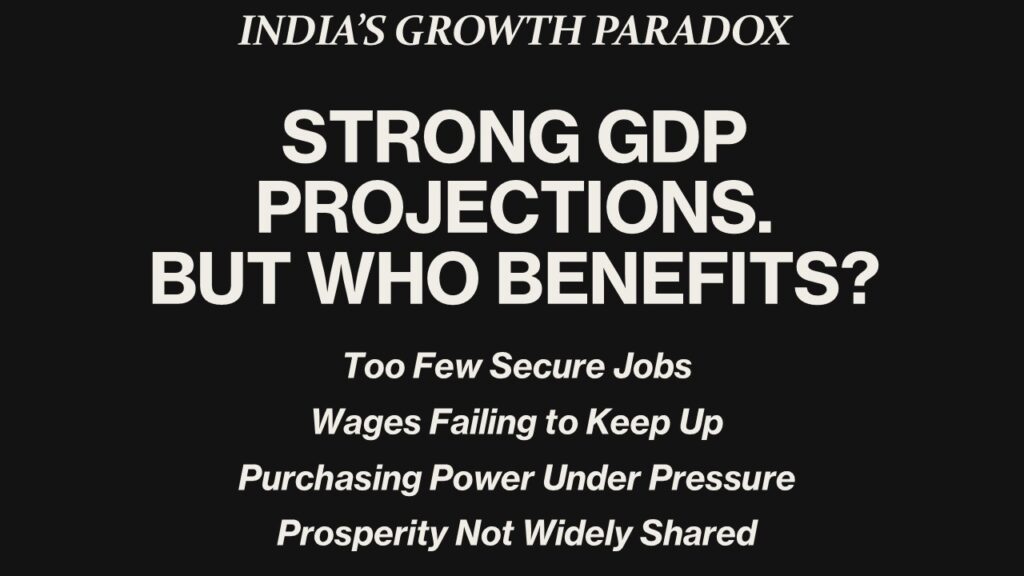
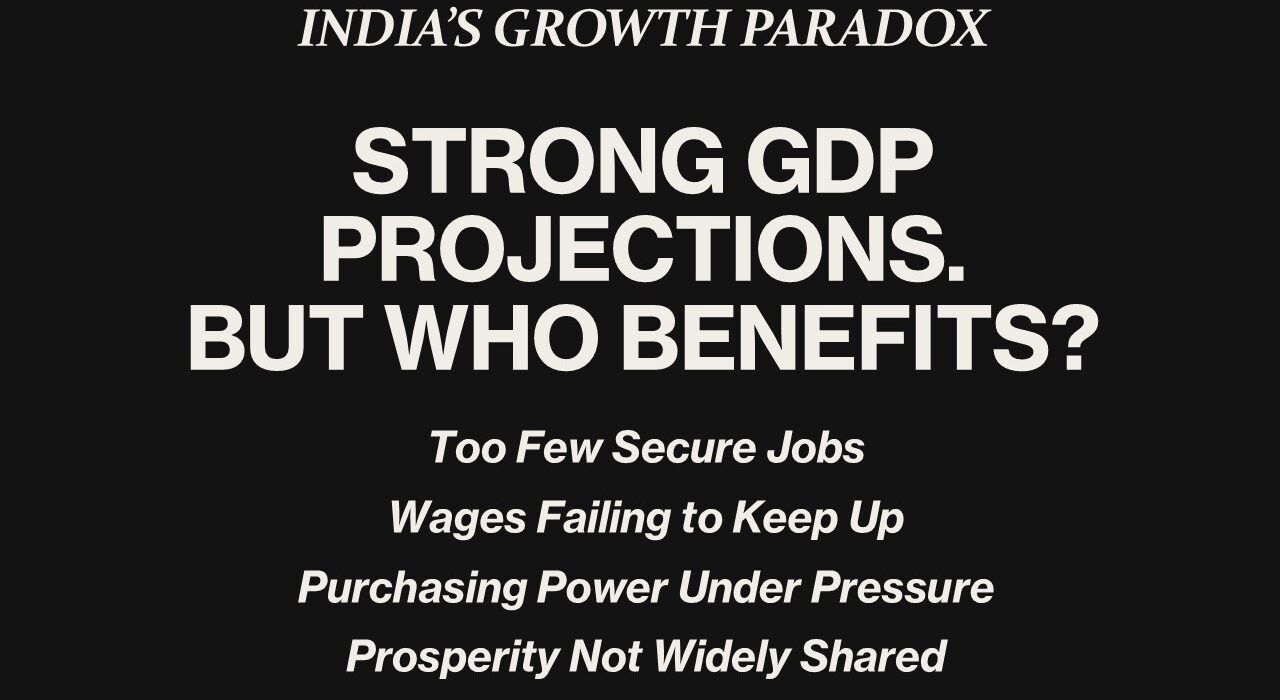
Official forecasts point to strong economic growth. But debates over headline GDP figures—and persistent concerns about jobs, purchasing power and household expenses—raise a more fundamental question: how widely is the promise of growth being shared?
India’s economy can grow rapidly without making every Indian more prosperous. The real test is not simply how much the country produces, but whether people gain secure jobs, stronger purchasing power and a genuine opportunity to build a better future.
Consider two realities within the same economy.
In one, official projections point to impressive economic growth. In the other, young graduates spend years preparing for competitive examinations, middle-class families watch their savings disappear into education and healthcare costs, and small businesses struggle with operating expenses, credit and uncertain demand. Parents worry about whether their children will find stable employment. Salaried households wonder why rising expenses seem to consume every increase in income.
Both realities can coexist. And that is the growth paradox.
It raises a question that every citizen, business leader and policymaker should confront:
If strong economic growth is projected, why do so many people still feel financially insecure?
The answer begins with a distinction frequently lost in public debate: economic growth and widespread economic prosperity are not the same thing.
Gross Domestic Product (GDP) measures the value of economic output. On its own, however, it cannot tell us who benefits from that output, whether enough productive and secure jobs are being created, whether wages are keeping pace with essential expenses, or whether households can withstand a financial emergency.
Corporate profits may rise without a corresponding improvement in workers’ incomes. Asset owners may benefit from rising valuations while people without substantial savings or property struggle to get ahead. An economy may expand while access to opportunity and financial security remains uneven.
India’s economic story therefore demands more than celebration or criticism. It demands a careful examination of evidence, competing interpretations and the structural choices that influence the lives of millions.
In this October 2026 edition, we examine five indicators that reveal more about the quality of economic growth than GDP alone: growth quality, employment quality, purchasing power, fiscal sustainability, and productivity and innovation.
We then investigate the debates surrounding wealth concentration and GDP measurement, the challenges confronting job seekers and manufacturing, and the potential effects of global conflicts, oil prices, US interest rates and artificial intelligence on India’s economic prospects and ordinary households.
Finally, we move from diagnosis to a practical, three-phase reform agenda focused on productive employment, purchasing power, human capital, enterprise growth and more inclusive prosperity.
The purpose is neither to dismiss India’s achievements nor to assume that every criticism is correct. It is to ask a more demanding question: Is India’s projected economic growth translating into a stronger economic future for the majority of its people—and what would it take to make that happen?
To answer that question, we must look beyond headline figures and examine the evidence, the competing explanations and the choices that will shape India’s economic future.
India’s Economic Outlook: What Has Changed in October 2026?
Seven things changed since the last version:
- The GDP headline is contested. A new base year (2022-23), a low implicit deflator and ‘double deflation‘ are making many economists ask whether 7.8% growth is overstated.
- War and oil. The Iran conflict (from late February 2026), Strait of Hormuz disruption and Russia-Ukraine sanctions have pushed Brent back above $100, weakened the rupee to about ₹96–97 and forced the RBI to hike.
- The US Treasury. The 10-year US yield is about 5.25% and the 30-year touched 5.6%, the highest since 2002. Foreign investors have pulled over ₹3 lakh crore from Indian equities in 2026.
- Savings. Stocks and gold face headwinds from high yields, a strong dollar and rate hikes; bank FDs are the safer home for money needed within a few years, though they do not build wealth.
- Manufacturing. Manufacturing is stuck at roughly 13–17% of GDP depending on the series and measure. Without factories, mass jobs do not appear.
- AI. Layoffs and a hiring freeze in IT services are closing the traditional stepping-stone career for graduates.
- The reform roadmap now includes explicit steps to protect household savings and to retool education for an AI economy.
The Economic Health Scorecard: Five Indicators Beyond GDP
How to evaluate the real strength of an economy: look beyond headline GDP. True economic strength is measured by durability, equity and broad-based prosperity.
Indicator 1: Is India’s Economic Growth Creating Shared Prosperity?
Growth Quality: Is Economic Expansion Sustainable and Inclusive?
Inclusive growth is productivity-anchored, employment-creating, and distribution-adjusted.
| Parameter | What Good Looks Like (Inclusive) | What Bad Looks Like (Exclusive) | Where Headlines Can Mislead |
| Source of Growth | Growth driven by manufacturing, high-value exports, technology diffusion, and SME expansion | Growth driven by debt-fueled consumption, real estate speculation, leverage, and short-term spending | The ‘services-led growth’ story: a high services share of GDP is celebrated, but services growth is often low in employment and unevenly distributed |
| Productivity Core | High and rising Total Factor Productivity (TFP) contribution. Value-added per worker increases | Growth reliant on factor accumulation without efficiency gains. Stagnant productivity | Celebrating the ‘fastest-growing’ label while employment elasticity falls; growth risks becoming jobless |
| Structural Balance | Rural-urban growth balance. Rising manufacturing-to-GDP ratio | Urban-biased, regionally concentrated growth. Premature deindustrialization | Visible infrastructure such as airports and metros gets the headlines; stagnant rural wages and agrarian distress get far less attention |
| Sustainability | Investment in green infrastructure, R&D, and human capital | Bubble growth in assets (stocks, real estate) detached from fundamentals | Confusing the stock market with the economy: a rising Sensex is celebrated as national prosperity, though fewer than 5% of Indians are estimated to own shares directly |
Indicator 2: Are Jobs Keeping Pace with Economic Growth?
Employment Quality: The Real Test of Economic Progress
Jobless growth is the clearest signal of exclusion.
The competition ratios shown later in this article translate directly into the labour market data: 710 aspirants per RRB NTPC vacancy is not a sign of enthusiasm—it is a measure of desperation.
The PLFS confirms the structural reality: 90% of India’s workforce lacks formal contracts, social security, or meaningful bargaining power.
| Parameter | Inclusive Indicator | Exclusive Reality (India) | Where Headlines Can Mislead |
| Quantity & Quality | High employment elasticity of growth. Rise in formal jobs with contracts and social security | Gig-ification and informalisation. Majority in insecure, low-productivity work. Stagnant Female LFPR (~25%) | Periodic labour force surveys can undercount discouraged workers and underemployment |
| Inclusivity | Rising Female and Youth LFPR. Closing gender wage gap. Skill-job matching improves | Youth unemployment high. Gender wage gap persistent. Caste-based occupational lock-in | Highlighting EPFO payroll additions without adjusting for re-enrolments and for the 10+ million people entering the workforce each year, most of whom are absorbed into informal work |
| Wage Dynamics | Wage growth tracks or outpaces productivity growth | Productivity-Wage Decoupling: Productivity rose; real wages for majority stagnated | Using Averages, Not Medians: Reporting “average wage” increases skewed by top earners, masking median wage stagnation |
Indicator 3: Are Indian Households Losing Purchasing Power?
Inflation, Real Wages and the Cost of Living
Inflation hurts the bottom 60% first and hardest.
| Parameter | Inclusive Stability | Exclusive Volatility (India) | Where Headlines Can Mislead |
| Essential Costs | Food, fuel, healthcare, education inflation lower than or equal to median income growth | Food & fuel inflation volatile and high, eroding purchasing power of poor who spend >50% income on these. Healthcare/education inflation in double digits | Core inflation (which excludes food and fuel) can look benign while headline inflation, which hits poorer households hardest, stays higher; check the full CPI and the basket the poor actually buy |
| Income vs. Price | Median household income growth > CPI inflation | Wage growth < essential inflation for bottom 50%, leading to savings erosion and debt | Celebrating GDP, Ignoring Real Incomes: “Economy grew at 7%” headlines ignore that real household incomes for the middle and bottom have barely grown |
Indicator 4: Is Public Spending Building Long-Term Prosperity?
Fiscal Sustainability: Investment Today, Resilience Tomorrow
Is borrowing building a bridge or just distributing freebies?
| Parameter | Prudent & Inclusive | Populist & Risky (India) | Where Headlines Can Mislead |
| Use of Borrowing | High capital expenditure (CapEx) on infrastructure, education, health. Long-term asset creation | High revenue expenditure on untargeted subsidies, cash transfers, and interest payments. Off-budget liabilities hidden | The ‘record capex’ narrative: absolute capex numbers look large, so check capex as a share of GDP and how spending is classified |
| Tax Justice | Progressive tax system: High direct tax share, effective wealth/inheritance taxes | Regressive system: Heavy reliance on indirect taxes (GST) that hit poor equally. Corporate & capital gains taxes cut. Weak wealth tax | ‘Record tax collection’ without context: collections rise with inflation, nominal growth and compliance; check the share from direct taxes and from the highest earners |
Indicator 5: Can Productivity and Innovation Broaden Prosperity?
Productivity and Innovation: Who Benefits from New Wealth?
Does the system enable a first-generation entrepreneur or only protect incumbents?
| Parameter | Inclusive Foundation | Exclusive Barriers (India) | Where Headlines Can Mislead |
| Human Capital | High-quality public education & healthcare. Effective vocational skill formation | Educational apartheid: Elite private vs. broken public schools. Skill mismatch. High out-of-pocket health spend | Highlighting enrolment rates while learning outcomes lag: ASER reports found many grade 5 children cannot read a grade 2 text |
| Business Climate | Ease of Doing Business for SMEs. Policy stability. Efficient contract enforcement | Policy volatility (sudden export bans, demonetization). Compliance burden on small firms. Judiciary delays | The World Bank’s Ease of Doing Business rankings (discontinued in 2021) were based on selected cities such as Mumbai and Delhi and may not reflect the everyday experience of small firms |
| Innovation & Access | R&D investment high. Capital access for newcomers. Anti-monopoly enforcement | R&D spending low. Credit starvation for SMEs. Crony capitalism and market concentration | “Start-up India” vs. Reality: Glorifying unicorns funded by foreign VC while ignoring grassroots innovation and small manufacturing starved of credit |
India’s Economic Reality: Growth, Jobs and Inequality
Why Economic Growth Is Not Reaching Everyone Equally
| Indicator | Reality |
| Top 1% wealth share | 40.1% of national wealth (2022–23) |
| Top 1% income share | 22.6% of national income |
| Billionaire wealth growth | +280% (2014–2022) – 10× faster than national income |
| UPSC competition | 1,195 applicants for every single vacancy |
| Tax-to-GDP ratio | ~11.1% vs. global average 15–20% |
| Income taxpayers | Only ~6% of Indians pay income tax |
The Structural and Policy Drivers of Inequality
- Tax structure – GST is a consumption tax that takes a larger share of poorer households’ income, and India has no wealth or inheritance tax
- Jobless growth – GDP rises; jobs don’t keep pace
- Weak manufacturing growth – services create fewer jobs per rupee of output and imports fill the gap
- Financialisation over production – banks and financial markets have attracted more capital than factories and farms
A Three-Phase Roadmap for Inclusive Growth and Shared Prosperity
| Phase | Timeline | Focus |
| Phase 1 | 1–3 years | Emergency job creation, social security, progressive fiscal first aid |
| Phase 2 | 3–7 years | Tax reform, industrial policy, human capital investment |
| Phase 3 | 7–15 years | Anti-concentration laws, election funding reform, new social contract |
What India’s Economic Trends Mean for Ordinary Families
The Cost-of-Living Reality for Families and Job Seekers
For Families Earning ₹25,000 Per Month
✅ You are in the top 10% of income earners
❌ Inflation on food, fuel, and healthcare has erased your wage growth
❌ Your child faces 1,195:1 odds for a government job
❌ You have no formal social security beyond what you can afford
For Families Earning ₹10,000 Per Month
✅ You are in the bottom 50%
❌ 60%+ of your income goes to food and fuel
❌ One medical emergency could wipe out your savings
❌ You have no bargaining power with employers
For Young Job Seekers
❌ You are competing against 1 crore applicants for 32,000 railway jobs
❌ Your education may not match market needs
❌ The private sector is not creating enough formal jobs
✅ Your frustration is not personal—it is systemic
This is not your fault. Many of these pressures reflect structural and policy choices—and choices can be changed.
India’s Employment Crisis: Why Job Creation Must Become a Priority
When Finding a Job Becomes a Lottery: The Pressure on Young Indians
We need to deal with employment generation on mission mode. Government should be an enabler and cannot be the only pathway to secure employment.
Violent protests over recruitment at railway stations in Bihar were not an aberration. They were a symptom of mass frustrated aspiration with too few places to go.
India’s Job Crisis: What the Competition Ratios Reveal
Five Competitive Examinations That Reveal the Demand for Jobs
| Examination | Vacancies | Applicants | Ratio |
| RRB Group D 2025 (Railways) | 32,438 | 1.08 crore | 333:1 |
| RRB NTPC 2025–26 | 8,868 | 63 lakh+ | 710:1 |
| SSC GD Constable 2025–26 | 25,487 | 51 lakh | 200:1 |
| SSC CGL 2025 | 14,582 | 28 lakh | 193:1 |
| UPSC Civil Services 2025 | 1,087 | 13 lakh | 1,195:1 |
Read these numbers slowly.
For every single UPSC vacancy, 1,195 young Indians compete.
For every RRB NTPC post, 710 aspirants are turned away.
These are not just statistics—they are the biography of a generation.
One Story Among Millions: The Human Cost of Job Insecurity
Meet Priya, 24, from rural Bihar. She has applied for 17 government exams in 3 years. She ranks in the top 5% nationally but still hasn’t secured a job. Her father sold their buffalo to pay for coaching. Her mother asks every week: ‘Beta, when will you get a job?’ Priya doesn’t have an answer. She is not lazy. She is not unqualified. She is competing against 1.2 million people for 32,000 jobs.
[Name has been changed to protect privacy]
Why Economic Expansion Is Not Creating Enough Jobs
The Growth Paradox: Rising Prosperity for Some, Growing Insecurity for Many
The pressure on the incomes and prospects of the most vulnerable households is not an abstract statistic. It is a lived reality, visible in swelling exam halls, protests over recruitment, and families selling assets to pay medical bills.
Some economists argue that India may be witnessing one of the largest concentrations of wealth at the top in its post-independence history. The scale, causes and policy remedies remain debated, which is why the evidence below matters.
Wealth Inequality in India: The Numbers Behind the Billionaire Raj Debate
| Metric | Data | Source |
| Top 1% wealth share | 40.1% of national wealth | World Inequality Lab (2022–23) |
| Top 1% income share | 22.6% of national income | World Inequality Lab |
| Billionaire wealth growth | +280% in real terms (2014–2022) | World Inequality Lab |
| Speed of billionaire growth | Nearly 10× faster than national income | World Inequality Lab |
| India’s inequality level | Exceeds colonial-era levels | Described as “Billionaire Raj” |
| Gross Tax-to-GDP ratio | ~11.1% (2023) | IMF |
| Global average Tax-to-GDP | 15–20% | IMF |
| OECD average Tax-to-GDP | ~34% | OECD |
| Income taxpayers | Only ~6% of Indians | CBDT |
What Official Data Shows—and What It Cannot Tell Us
Government data offers important context:
- HCES 2022–23: Average monthly per capita consumption expenditure has more than doubled since 2011–12
- Rural: ₹3,773
- Urban: ₹6,459
- Food spending: Still accounts for nearly half of rural spending
- Education & health costs: Have risen sharply—shifting burden from state to household
- Government Gini index: 25.5 (2022–23) suggests modest consumption inequality
But this masks deeper vulnerabilities:
Households may keep spending by borrowing or drawing down savings even when incomes are under pressure, so consumption data can understate distress.
India’s Employment Reality: What Labour-Market Data Reveals
- Labour force participation has improved
- But most employment growth is concentrated in informal and precarious work
- Regular wage jobs remain scarce
- Rural workers are disproportionately trapped in low-productivity agriculture or casual labour
- 90% of India’s workforce lacks formal contracts, social security, or meaningful bargaining power
India’s 7.8% GDP Growth: What the Headline Does—and Does Not—Tell Us
India’s Latest GDP Estimates: The Official Picture
India’s statisticians moved the GDP base year from 2011-12 to 2022-23 this year. Under the new series, growth in the first quarter of 2026-27 came in at 7.8%, ahead of the RBI’s own forecast of 7%. On 7 October the RBI raised its full-year FY27 growth forecast to 7.1%. Strong sub-indicators were cited as support: gross fixed capital formation up 11.9%, real exports up 12%, capital goods production up 15.2%.
Why Some Economists Question the New GDP Estimates
- The deflator gap. Nominal GDP grew 10.3% while real GDP grew 7.8%, which implies a GDP deflator of only about 2.3%. Over the same quarter CPI inflation was above 4% and wholesale (WPI) inflation above 9%. A deflator that is lower than the prices people actually pay mechanically lifts ‘real’ growth. Congress leader Jairam Ramesh has made this argument forcefully.
- Manufacturing deflator below zero. Manufacturing’s nominal gross value added grew 7.7% but real GVA grew 9.2%, implying prices in manufacturing fell about 1.5%. Defenders say this is possible under ‘double deflation’, a method the new series introduced; critics say that during a quarter of high oil and input prices it deserves a full explanation.
- A lower base. The revision cut the estimate for Q1 2025-26 nominal GDP from about ₹86 lakh crore to about ₹80 lakh crore, a drop of roughly ₹6 lakh crore. A smaller base makes any later growth rate easier to reach. (Comparing the new Q1 figure of ₹88.27 lakh crore directly with the old-series ₹86.05 lakh crore to claim growth of only 2.6% is not valid, because the two series use different bases and methods, but it does show why a published bridge between the series is needed.)
- Raghuram Rajan’s red flag. The former RBI Governor has questioned strong growth prints that sit alongside weak corporate investment and falling foreign capital inflows, saying the disconnect suggests ‘something is off‘.
- The economists disagree openly. Former Chief Economic Adviser Arvind Subramanian has argued that India’s GDP growth was overestimated by about 2.7 percentage points a year in earlier work; another former CEA, K.V. Subramanian, disputes that. Former Finance Minister Yashwant Sinha has gone further, alleging real growth is closer to 2–3%. Those higher estimates are contested claims, not official findings.
GDP Growth vs Jobs, Wages and Investment: The Reality Check
| Official headline | What other data shows (2026) |
| Real GDP growth 7.8% (Q1 FY27) | Tech job openings hit a 28-month low in June (Xpheno); urban youth unemployment 18.2% (PLFS, June 2026) |
| Strong investment and consumption narrative | Foreign investors have withdrawn over ₹3 lakh crore from Indian equities in 2026; Nifty 50 is down roughly 13–15% for the year |
| ‘Resilient economy’ (RBI Governor, 7 Oct) | Rupee at record lows near ₹96–97; RBI forced into its first rate hike since February 2023 |
| Low GDP deflator of about 2.3% | Headline CPI 4.8% in August; RBI now forecasts 5.2% for FY27 and 6% in Q3 |
| In fairness: supportive signals | Real exports +12%, capital goods +15.2%, machinery imports +51.5%, goods-vehicle registrations +20.1% in Q1. These suggest real activity, not just statistical effects |
Our reading. There is no evidence that anyone invented the figure. The sounder concern is that a new base year, a new deflation method and a changed price index have together produced a headline that is hard to reconcile with jobs, wages, capital flows and the currency, and that the Ministry of Statistics has not yet published the bridge, sector-level deflators and documentation needed to check it. Disputed claims should be treated as disputed: the case for caution is strong; the case for fabrication is not. Citizens can ask MoSPI for a clear old-to-new series bridge, and ask for median wages and employment alongside GDP.
Oil Prices, Global Conflict and the Rupee: The Impact on Indian Households
Middle East Tensions and the Strait of Hormuz: Why India Is Exposed
India imports about 89% of the crude oil it uses (88.7% in FY26) and holds roughly 25 days of strategic reserves. When conflict involving Iran, Israel and the US escalated from the end of February 2026 and shipping through the Strait of Hormuz was disrupted from 1 March, India was exposed on oil, gas and cooking fuel at once.
| Pressure point | What the latest data shows |
| Crude price path | Brent touched $118 in March 2026, fell to about $73 in June, then climbed back to about $107 by mid-September; it was $102.90 on 9 October |
| Cooking gas and LNG | About 91% of India’s LPG comes from the Gulf and Qatar and the UAE supply roughly half its LNG. In March the government prioritised gas distribution, capped fertiliser plants near 70% of gas requirement and household LPG cylinders rose about ₹60 |
| Import bill | Petroleum, oil and lubricant imports were $60.6 billion in April-June 2026 against $49.2 billion a year earlier |
| Current account | Deficit was a modest 0.5% of GDP in Q1 FY27, but at $100 Brent the FY27 deficit is projected near 2.1% of GDP. Each $10 rise in crude adds roughly 0.5 percentage points (RBI rule of thumb) |
| Rupee | Broke 92 per dollar in March (RBI spent an estimated $12–15 billion defending it) and is now about ₹96–97, a record low |
| Inflation and rates | A 10% rise in crude adds about 0.3 percentage points to inflation and cuts growth about 0.15 points. CPI was 4.8% in August; the RBI raised the repo rate 25 bps to 5.50% on 7 October and now projects 5.2% inflation for FY27 |
| Remittances | About 38% of India’s remittances come from the Middle East, so a prolonged regional war threatens household incomes in Kerala, Uttar Pradesh, Bihar and elsewhere as well as the import bill |
Russian Oil, Sanctions and India’s Energy-Security Challenge
Discounted Russian crude has been India’s shock absorber since 2022. In 2026 that cushion has become unstable. Russia’s share of India’s crude imports jumped from about 19% in February to nearly half by July, with a record 2.82 million barrels a day, then fell to about 2.08 million in August and roughly 1.42 million in early September as Chinese refiners outbid Indian buyers. Meanwhile Washington cut its tariff on Indian goods from 50% to 18% in February (the 50% had included a 25% penalty for buying Russian oil) but said the extra 25% could return if India resumes large-scale purchases. On 16 September the US House passed a sanctions bill that would allow tariffs of up to 100% on countries that depend on Russian energy, and India has warned that it could damage ties. India is therefore squeezed from both sides: dearer Gulf oil and a riskier Russian discount.
Who Bears the Cost of Higher Oil Prices?
- Households: LPG, petrol and diesel, and food through transport and fertiliser costs. The poorest spend over half their income on food and fuel.
- MSMEs: energy and input costs rise while demand softens, squeezing the very enterprises that employ the most people.
- Borrowers: the RBI’s rate hike lifts EMIs on floating-rate home and business loans.
- Airlines, paints, chemicals, fertilisers and city gas distributors: among the most exposed sectors. Upstream producers such as ONGC and Oil India benefit.
In balance, India has real buffers: forex reserves of about $740.8 billion (28 August), a low current account deficit and falling dependence of the economy on oil (crude imports about 4.8% of GDP against 8.5% in 2012). The stress is real but manageable; the larger point is that an economy with weak manufacturing and a large import bill pays for every geopolitical shock out of ordinary families’ pockets.
US Treasury Yields and Indian Markets: How Global Interest Rates Affect the Sensex
How Higher US Yields Can Affect Indian Investors
| Step | What is happening |
| 1. US yields surge | The 10-year Treasury yield is about 5.25% (it hit a 24-year high of 5.33%, up about 110 bps this year); the 30-year topped 5.6% on 29 September, the highest since 2002 |
| 2. Why they are rising | Annual US deficits near $2 trillion and about $1 trillion in yearly interest costs mean heavy borrowing; foreign buyers such as China and Japan are buying less; inflation worries are persistent and the Fed raised rates 25 bps in September, with markets pricing a further hike in October |
| 3. Safe dollars beat risky rupees | When the ‘risk-free’ US government pays over 5%, global funds demand much more to hold Indian equities, and capital also rotates towards AI-driven markets in North Asia |
| 4. Foreign investors sell | Foreign portfolio investors (FPIs) have sold ₹44,166 crore in October so far and over ₹3 lakh crore (roughly $30+ billion) in 2026 |
| 5. Rupee falls | Foreign investors converting rupees back into dollars pushes the rupee to about ₹96–97, which further cuts dollar returns for those who stay and raises India’s import costs |
| 6. RBI tightens, valuations compress | The RBI hikes to defend the currency and contain inflation. Higher rates reduce what future earnings are worth, so share prices fall |
The result: the Nifty 50 is down roughly 13–15% in 2026 and the Sensex closed at 72,472 on 9 October, well below the roughly 80,000 level cited in earlier versions of this article. It ended an eight-week losing run that day, helped by domestic institutions who bought ₹4,743 crore against ₹3,569 crore of foreign selling. That is the pattern of 2026: Indian households and mutual funds absorbing what global investors dump.
This is the ‘hot money’ risk that economists often flag for emerging markets: an economy that depends on foreign portfolio flows has little say when the cost of money is set in Washington. A falling market does not by itself mean a collapsing economy, but it does show how exposed the savings of the roughly 5% of Indians who own shares have become to decisions made abroad.
Stocks, Gold and Fixed Deposits: Understanding Risk and Short-Term Savings
A note first: this section is general analysis of current conditions, not personalised investment advice. Past and present data do not predict future returns, and circumstances differ for every household.
Stocks vs Gold vs Fixed Deposits: The October 2026 Comparison
| Asset | What the evidence says | Short-term outlook |
| Equities (Nifty / Sensex) | Nifty down roughly 13–15% for 2026; FPIs have sold over ₹3 lakh crore; US yields above 5%; RBI has begun tightening; high crude squeezes corporate margins; global money is chasing AI markets in North Asia | Limited upside and high volatility over the next 12–24 months. Long-horizon investors (7+ years) can keep investing steadily, but money needed soon should not be exposed |
| Gold | About ₹1.49 lakh per 10 grams and about $4,144 an ounce, near a two-month low; it fell after the RBI hike. Pressures: high US bond yields, a firm dollar and rate hikes. Support: a weak rupee and central-bank buying | After a huge multi-year run, new buyers face a high entry price. Gold remains insurance against crises but is not a reliable growth engine from here |
| Bank fixed deposits | SBI’s published card shows about 6.25% for 1–2 years, 6.40% for 2–3 years and 6.45% for 444 days; senior citizens get about 0.50% more. (The SBI table we saw is dated December 2025; after the RBI’s 7 October hike, rates are more likely to rise than fall, so check current rates) | Predictable, capital-protected and now paying more than recent equity returns. Suitable for money needed in 6 months to 3 years |
Fixed Deposits for Short-Term Goals: Benefits and Limitations
- Certainty beats volatility. A 6%+ guaranteed return, against an equity index that has fallen double digits this year, is a real advantage when you need the money on a known date.
- Rates may rise further. The RBI has moved to ‘calibrated tightening’, so FD rates may drift up. Splitting deposits across tenors (a ‘ladder’) lets you roll maturing money into higher rates.
- Deposit insurance. Bank deposits are insured by DICGC up to ₹5 lakh per depositor per bank, so large sums are better spread across institutions.
- The honest caveat: FDs do not create wealth. With CPI projected at 5.2% for FY27, a 6.25% FD earns only about 1% in real terms before tax. Interest is taxed at your slab rate; for someone in the 30% bracket the after-tax return is roughly 4.3%, which is below inflation. An FD protects capital and gives certainty; it will not beat inflation for higher-bracket savers.
How to Match Savings Choices to Your Time Horizon
| When you need the money | What suits the current environment |
| Within 1 year (emergency fund, school fees, tax) | Savings account, liquid funds or short FDs. Do not risk this in equities or gold |
| 1–3 years (down payment, wedding, a planned business) | A ladder of FDs across 1, 2 and 3 years; consider small gold holding only as insurance |
| 3–7 years | A balanced mix; rising rates make short-duration debt attractive, equities only for the portion you can leave untouched through a downturn |
| 7+ years (retirement, children’s long-term goals) | Continue systematic equity investing; volatility is the price of long-run returns, and low prices buy more units |
India’s Manufacturing Gap and AI: Why Educated Young People Face a Tougher Job Market
Why Manufacturing Has Not Created Enough Jobs
Countries that escaped poverty, from South Korea to China to Vietnam, put millions of workers in factories. India went from farms straight to services and skipped that stage. Manufacturing’s share of the economy has stayed stuck for more than a decade, while the Make in India target of 25% of GDP, set in 2014, has now been pushed out to 2035 under the National Manufacturing Mission.
| Measure | Latest figure |
| Manufacturing share of GVA (old 2011-12 series) | About 17–18%; peaked at 18.5% in 2021-22, 17.2% in 2024-25 |
| Manufacturing share of GVA (new 2022-23 series) | 14.5% in 2022-23, rising to about 16.3% in the latest year shown |
| World Bank measure | Fell from 15% of GDP (2018) to 13% (2024) |
| Peers in 2024 | Indonesia 19%, Malaysia 23%, Vietnam 24%, China 25% |
| Q1 FY27 manufacturing growth | 9.2% in real terms, yet no matching jump in hiring: output is becoming more capital-intensive, and the negative price deflator means the real figure itself is contested |
Output growth in capital-intensive plants does not employ the 5 million graduates and the millions of school-leavers who enter the workforce each year. Labour-intensive manufacturing, such as apparel, footwear, electronics assembly and light engineering, is what absorbs large numbers. With energy costs up, the rupee volatile and MSME credit tight, those sectors are being squeezed in 2026 rather than expanded. Fewer factory jobs means more people chasing the same few public and private white-collar posts, which is exactly what the exam-hall ratios earlier in this article show.
Graduate Unemployment: What the Available Data Suggests
- Graduates are the hardest hit. The Azim Premji University’s State of Working India 2026 reports that about 40% of graduates aged 15–25 and about 20% of those aged 25–29 cannot find work, and that fewer than 7% of male graduates got a permanent salaried job within a year of graduating.
- Urban youth unemployment was 18.2% in the latest PLFS data (June 2026), and unemployment among young women is above 25%.
- Around 5 million graduates enter the workforce every year, and more than half are unemployed or underemployed.
AI and Entry-Level Jobs: How Automation Is Changing Hiring
For two decades Indian IT services were the escalator for the educated middle class: engineering degree, campus placement, steady salary, a home loan. That escalator is stalling.
- Layoffs: Oracle laid off about 12,000 people in India in March 2026 and TCS about 12,000; an estimated 50,000 Indian IT workers lost jobs in the past year; globally, Amazon cut 30,000 jobs over seven months and Microsoft 15,000 last year.
- Hiring freeze for freshers: tech job openings hit a 28-month low in June (Xpheno). Investor Saurabh Mukherjea notes that IT services hiring of ordinary engineering graduates has fallen close to zero over three years, even though India produces about 3 million engineers a year.
- Which jobs go first: entry-level work such as data entry, basic coding, testing, customer service and back-office processing, because AI performs these tasks quickly and cheaply. Growth is becoming capital-intensive, so firms can expand profits without hiring.
- Knock-on effects: house sales in India’s top cities fell 13% in the first quarter of 2026, with IT layoffs cited as one cause; about 6 million people work in IT, and each carries a household’s EMIs and school fees.
A balanced note: AI is also creating new roles. Global capability centres (GCCs) and AI-related teams are hiring, and some firms are cutting mid-tier roles while expanding entry roles for AI-skilled graduates. The problem is not that educated Indians are unemployable, but that the old, easy entry route is closing before the new one is wide enough, and the curriculum has not yet adapted.
What Students, Graduates and Parents Can Do Next
| If you are… | Practical response |
| A student or fresher | Build AI-fluent skills (using AI tools to do your domain’s work), applied projects, certifications and a visible portfolio; a degree alone is no longer a differentiator |
| An IT or services professional | Move from task execution toward roles AI augments rather than replaces: domain expertise, client handling, system design, data and security; keep 6–12 months of expenses in safe instruments |
| A parent funding coaching or education | Compare cost against realistic outcomes; consider vocational, technical and manufacturing-linked skills where demand exists |
| A policymaker | Tie incentives to jobs, revive labour-intensive manufacturing clusters and MSME credit, and rebuild curricula for an AI economy (see the reform roadmap) |
India’s Central Contradiction: Private Wealth and Public Capacity
India’s Economic Risks in October 2026: Six Signals to Watch
- RBI raised the repo rate to 5.50% on 7 October 2026 — its first hike since February 2023 — and changed its stance to ‘calibrated tightening’
- Rupee at record lows, around ₹96–97 per US dollar (it breached ₹92 in March 2026)
- Foreign investors have pulled over ₹3 lakh crore from Indian equities in 2026, including ₹44,166 crore in October alone; the Nifty 50 is down roughly 13–15% for the year
- Crude oil remains above $100 (Brent $102.90 on 9 October), with RBI projecting 5.2% inflation for FY27
- US Treasury yields at multi-decade highs: 10-year about 5.25%, 30-year about 5.6%
- Hiring is weak: tech job openings hit a 28-month low in June, and IT-services hiring of freshers has slowed sharply
This looks less like a routine downturn and more like a structural stress test: a weak currency, imported inflation, foreign capital flight and too few jobs are reinforcing each other.
Productive Economy or Rentier Economy? India’s Structural Choice
| The risk: a rentier-style economy | The goal: a productive economy |
| Banks lend mainly against assets and consumption rather than new productive capacity | Banks fund manufacturing, MSMEs and innovation |
| IT services sell skilled labour at scale but own little proprietary intellectual property | Technology firms build proprietary products and intellectual property |
| Large groups grow by acquiring assets and market share more than by investing in R&D | Large firms invest in R&D and build supply chains and jobs |
| Manufacturing’s share stays stagnant and critical components such as semiconductors are largely imported | Manufacturing creates jobs and exports |
The trap:
A weaker rupee raises import costs → inflation rises → real wages fall → demand and hiring weaken, especially when export capacity and domestic manufacturing are thin.
This is a self-reinforcing trap.
Why Inequality Persists: The Structural Drivers
Why Economic Opportunity Remains Unequal
The top 1% holds roughly 40% of national wealth on World Inequality Database estimates, while the bottom 50% holds a small share. Many economists argue this reflects policy and institutional choices rather than chance.
The Historical Roots of Wealth and Opportunity Gaps
| Factor | Impact |
| Colonial Extraction Legacy | Created an unequal baseline in assets and institutions |
| Highly Unequal Initial Asset Distribution | Land and capital concentrated post-Independence |
| Caste-Linked Occupational Lock-In & Discrimination | Limits mobility for SC/ST/OBC groups in education, jobs, capital access |
| Inherited Wealth Compounding | Dynastic wealth in business and agriculture |
| Urban Bias in Development Planning | Decades of policy favoring industrial/urban over rural |
How Policy Choices Shape Inequality and Growth
| Factor | Impact |
| Liberalisation Without Redistribution | Markets opened, but no strong wealth/land taxes or social security |
| Growth Biased Toward Capital-Intensive Sectors | IT, telecom, real estate over labour-intensive manufacturing |
| Regressive Fiscal Policy | Shift from direct to indirect taxes (GST burden on poor); Corporate tax cuts (2019) without job creation mandates |
| Weak or Absent Wealth, Inheritance, and Capital Gains Taxes | r > g (Piketty) operates unchecked |
| Financialisation Over Production | Policy favoring stock markets and financial engineering over real manufacturing |
| Crony Capitalism & Policy Capture | Nexus between political/bureaucratic elite and big business |
| Demonetisation & GST | Disproportionately devastated cash-dependent informal sector and small businesses |
Why India’s Labour Market Struggles to Deliver Secure Work
| Factor | Impact |
| Jobless Growth & Low Employment Elasticity | GDP rises; jobs don’t keep pace |
| Massive Informalisation | 90% of workforce lacks contracts, social security, or bargaining power |
| Deliberate Contractualisation & Gig-ification | Formal sector reducing wage bills through contract labour |
| Erosion of Labour Unions & Collective Bargaining Power | Workers have no voice |
| Stagnant Real Wages | Bottom 60%, especially in agriculture and informal sectors |
| Falling Female Labour Force Participation Rate | Lack of safe, suitable jobs |
| Skill-Biased Technological Change | Rewards only the highly educated |
The Jobs Gap: Why Aspirations Outpace Opportunities
When 1,195 young Indians compete for every single UPSC vacancy, the labour market failure is not individual—it is systemic.
The government cannot be the employer of last resort for a workforce of 600 million.
Without a manufacturing revolution and SME ecosystem, the aspirations of this generation will curdle into resentment.
Education and Healthcare: Unequal Access, Unequal Outcomes
| Factor | Impact |
| Quality Gap in Education | World-class private vs. broken public schools |
| Elite Capture of Higher Education | IITs/IIMs dominated by those who can afford coaching |
| Digital Divide | Lack of internet/devices excludes poor from online education and gig work |
| Healthcare as a Luxury Good | Low public spending forces high out-of-pocket expenditure, creating medical poverty |
| Inter-generational Transmission of Advantage | Children of elites get networks, soft skills, capital |
Why Access to Credit Matters for Small Businesses
| Factor | Impact |
| Credit Access Skewed | 70%+ of formal credit goes to large corporates and affluent individuals |
| SME Credit Starvation | Despite being the largest employers, they get a fraction of formal credit |
| Asset Price Inflation | Real estate and stock market booms benefit only asset-holders (top 10%) |
| Offshore Wealth & Tax Evasion | Panama/Paradise Papers revelations; illicit flows to tax havens |
| Predatory Informal Lending | Poor trapped in debt cycles with local moneylenders |
India’s Uneven Development: Regional and Rural–Urban Gaps
| Factor | Impact |
| Weak Redistribution Mechanisms | Leakage in welfare schemes; poor targeting |
| Chronic Underfunding of Public Services | Health, education, municipal services |
| Corruption in Public Procurement | Inflates costs, enriches intermediaries |
| Weak Property Rights for Poor | Slum dwellers, tribals lack titles, vulnerable to displacement |
| Judicial Delays | Justice is expensive and slow, favoring those with resources |
| Factor | Impact |
| Inter-State Inequality | Southern/Western states race ahead; BIMARU states lag |
| Urban-Rural Divergence | Infrastructure, jobs, and investment concentrated in metros |
| Migration Distress | Poor migrants face discrimination, low wages, insecure housing |
| Infrastructure Concentration | Highways and airports over rural roads and irrigation |
How Institutions Influence Economic Opportunity
| Factor | Impact |
| Political Capture by Economic Elites | Funding elections, influencing policy |
| Media Owned by or Beholden to Corporate Interests | Glorifies billionaires, ignores inequality |
| Normalisation of Inequality as Merit | Narrative of “wealth creators” vs. “freebie seekers” |
| Erosion of Social Solidarity & Collective Action | Caste/communal divisions prevent class solidarity |
| Lack of Wealth Transparency | No public registry of beneficial ownership |
Global Forces That Can Widen Economic Inequality
The Global Economic Forces Reshaping India
These forces, identified by Piketty, Saez, Stiglitz, and others, operate globally and are amplified in India.
Capital, Technology and Work: Who Captures the Gains?
| Factor | Impact |
| Returns on Capital (r) > Economic Growth (g) | Wealth grows faster than output/incomes, concentrating assets |
| Wealth Compounds Faster Than Wages | The rich save and invest a larger share of income |
| Inheritance Dominance Over Entrepreneurship | The 21st century is marked by the return of patrimonial wealth |
| Capital Ownership Hyper-Concentration | Top 1% owns the majority of financial and non-financial assets |
AI, Innovation and the Future of Employment
| Factor | Impact |
| Skill-Biased Technological Change | Tech complements high skills, substitutes for low skills |
| Automation & AI | Displaces routine middle-class jobs (clerical, manufacturing) |
| Winner-Take-All/Superstar Markets | Global scale allows top performers to capture enormous rents |
| Network Effects & Platform Monopolies | Digital platforms create near-natural monopolies |
| Financialisation | Economy shifts from producing goods to trading financial assets, benefiting owners of capital |
Globalisation: Growth Opportunities and Unequal Outcomes
| Factor | Impact |
| Capital Mobility vs. Labour Immobility | Capital flees to low-tax havens; workers cannot follow |
| Global Wage Arbitrage & Outsourcing | Depresses wages in advanced economies; creates low-wage, insecure jobs in developing ones |
| Race to the Bottom | Countries compete by lowering corporate taxes and labour protections |
Policy Choices, Institutions and Economic Inequality
| Factor | Impact |
| Decline of Progressive Taxation | Top marginal tax rates collapsed from 70–90% (1970s) to 25–40% today |
| Erosion of Wealth, Estate, and Inheritance Taxes | Wealth concentration goes unchecked |
| Deregulation of Finance & Labour Markets | Weakened unions, eroded job security |
| Shift to Shareholder Value Maximization | Prioritizes stock buybacks/dividends over wage increases |
| Surging Executive Compensation | Tied to stock prices, disconnected from worker pay |
| Austerity & Underinvestment in Public Goods | Cuts to education, health, housing |
Social and Demographic Factors That Reinforce Inequality
| Factor | Impact |
| Assortative Mating | High earners marry each other, doubling high-income households |
| Educational Homogamy & Credential Inflation | Elite degrees become mandatory for elite jobs |
| Gender & Caste Discrimination | Systematically lowers earnings for women and minorities |
| Intergenerational Transmission of Advantage | Beyond wealth, includes education, networks, soft skills |
Ideology, Wealth and Power: Understanding Inequality Regimes
| Factor | Impact |
| Meritocracy as a Justifying Myth | Inequality is framed as earned, ignoring head starts and structural advantage |
| Political Capture | Wealth translates into political influence, shaping rules to favour the rich |
| Media Narratives | Owned by elites, often downplaying inequality’s dangers |
What Leading Economists Say About India’s Economic Future
Seven Perspectives on India’s Economic Risks and Opportunities
| # | Voice | Perspective | In Plain English |
| 1 | Uday Kotak – Founder, Kotak Mahindra Bank (post on X, 2 June 2026) | Said Google’s market capitalisation (about $4.5 trillion) and annual profit (about $160 billion) are ‘close to total profits and market cap of all Indian listed companies put together’, and called Google’s $80 billion capital raise ‘a wake up call to all companies to invest into the future’. (His comparison has not been independently verified.) | India’s companies must invest in future capabilities, not just present profits. |
| 2 | Raghuram Rajan – Former RBI Governor | Has questioned strong growth prints that sit alongside weak corporate investment and falling foreign capital inflows, saying the disconnect suggests ‘something is off’ (India Today TV interview, as reported). | When growth numbers and the investment picture do not match, ask more questions. |
| 3 | Arvind Subramanian and K.V. Subramanian – Former Chief Economic Advisers | Arvind Subramanian has argued that India’s GDP growth was overestimated by about 2.7 percentage points a year in earlier work. K.V. Subramanian disputes this, arguing such a gap would compound visibly. | Even former top government economists disagree on how fast India is really growing. |
| 4 | Amartya Sen – Nobel laureate economist | Has long argued that development should be judged by people’s real freedoms and capabilities, including health, education and opportunity, and not by output alone. | Growth matters only if it improves how people actually live. |
| 5 | Thomas Piketty – Economist, Paris School of Economics | Argues that when returns on capital exceed the growth rate (r > g), wealth tends to concentrate, and that inequality is shaped by institutions and political choices. | Inequality is not a law of nature; rules and policies shape it. |
| 6 | Joseph Stiglitz – Nobel laureate economist | Argues that extreme inequality weakens demand, undermines institutions and can slow growth. | A very unequal economy can become a weaker and less stable one. |
| 7 | Azim Premji University – State of Working India 2026 | Reports that about 40% of graduates aged 15–25 and about 20% of those aged 25–29 cannot find work, and that fewer than 7% of male graduates get a permanent salaried job within a year. | Education alone is no longer a guarantee of a good job. |
India’s Inequality Debate: Common Claims and Available Evidence
| Claim | What the evidence says |
| “India is the fastest-growing economy” | Growth without enough productive jobs does not translate into broad prosperity. Employment growth has lagged output growth, and the headline growth figure is itself debated (see the GDP section above). |
| “We lifted 250 million out of poverty” | Poverty estimates vary by method and year, and recent consumption data have been revised. Headcount poverty is one measure; real incomes, job quality and resilience to shocks matter too. |
| “We can’t afford welfare programmes” | India’s tax-to-GDP ratio (about 11% on the IMF measure cited above) is lower than in many comparable economies (15–20%), which suggests some fiscal space exists, although priorities and trade-offs are debated. |
| “Rich people create jobs” | Investment by large firms matters, but evidence suggests small and medium enterprises employ far more people per rupee of capital than capital-intensive conglomerates. Wealth concentration does not automatically translate into job creation. |
| “The stock market is booming” | An often-cited estimate is that fewer than 5% of Indians own shares directly, and the market has fallen roughly 13–15% in 2026. Market levels are a poor guide to household prosperity in either direction. |
A Practical Blueprint for Inclusive Economic Growth
From Economic Diagnosis to Practical Reform
This is not a Wishlist. It is an implementable plan derived from the diagnosis above, combining immediate relief with structural change.
Phase 1: Immediate Measures to Protect Households and Create Jobs
Improve Inflation Measurement and Policy Responses
| Action | Details |
| Create a Poor Person’s Price Index (PPPI) | Track inflation for the bottom 50’s consumption basket |
| RBI communication | Publish the PPPI alongside headline CPI and explain divergences in policy statements |
| Public audit | Explain divergence between headline, core, and PPPI |
Expand Employment and Strengthen Social Protection
| Action | Details |
| Urban MGNREGA | Scale up for towns and cities, guaranteeing 100 days of public works |
| Universal National Social Security Scheme | For all informal workers (pension, accident insurance) |
| Funding | Windfall taxes on pandemic-era super-profits in pharmaceuticals, IT, and commodities |
Create Jobs Through a Coordinated National Employment Strategy
Government should be an enabler and cannot be the only pathway to secure jobs.
| Priority | Action |
| Private sector job creation | Mandates tied to PLI scheme benefits |
| Apprenticeship quotas | Mandatory for firms above 50 employees |
| Industrial clusters | Fast-track development in Tier-2 and Tier-3 cities |
| Transparency | Real-time public dashboard of vacancies vs. applicants for all government exams |
Short-Term Fiscal Measures to Protect Vulnerable Households
| Action | Details |
| Recovery surcharge | On incomes over ₹1 crore and corporate profits above ₹100 crore for 3 years |
| Remove GST | On all essential items (food grains, medicines, sanitary products) |
| Fund welfare | Use revenue to fully fund NFSA (food security) and Ayushman Bharat, removing co-pays |
Protect Household Savings and Financial Resilience
| Action | Details |
| Protect Savings | Encourage conservative capital allocation into high-yield fixed instruments (bank FDs, government savings schemes) for risk-averse savers navigating market volatility; publish clear, plain-language guidance on risk |
| Raise deposit insurance | Review the ₹5 lakh DICGC limit against today’s incomes and savings |
| Energy price shield for the poor | Targeted LPG and fuel support for the bottom 50% so global oil shocks do not wipe out household budgets |
Phase 2: Structural Reforms for Productivity and Employment
Tax Reform: Fairness, Simplicity and Sustainable Revenue
| Reform | Details |
| Wealth Tax | 2% annual tax on net wealth exceeding ₹10 crores |
| Inheritance Tax | Progressive tax on inheritances above ₹5 crores (with primary residence exemption) |
| Treat Capital as Labour | Equalise Long-Term Capital Gains tax with top income tax slab |
| Global Minimum Tax & Transparency | Aggressively implement OECD rules. Create a public beneficial ownership registry |
A Productivity and Employment Pact
| Reform | Details |
| Industrial Policy 2.0 | Target labour-intensive manufacturing (apparel, footwear, electronics assembly) with PLI-like schemes with strict job creation clauses |
| SME Revolution | Create a Right to Credit via a guaranteed, streamlined MSME loan window at public banks |
| Formalise Labour | Significant tax incentives to firms that convert contract workers to permanent roles with ESIC/EPFO |
| Anchor Sectors | Semiconductors, EVs, and defense manufacturing for 10-year industrial strategy |
Education, Healthcare and Skills as Long-Term Investments
| Reform | Details |
| Constitutional Amendment | Make Right to Quality Education & Healthcare justiciable. Raise public spending to 6% of GDP on Education and 3% on Health |
| National Teacher Corps & Public Health Cadre | Deploy high-quality professionals to underserved districts |
| National Digital Public Infrastructure for Skilling | Free, modular, vernacular skill courses linked to verifiable digital credentials |
Revive Manufacturing, Strengthen MSMEs and Prepare Workers for AI
| Reform | Details |
| Manufacturing & MSME Revival | Shift industrial policy incentives (such as PLI schemes) to strictly mandate employment generation, and ease formal credit access for small businesses; target apparel, footwear, electronics assembly and light engineering |
| AI & Skill Adaptation | Overhaul public educational curricula to focus on critical thinking, applied technology management and vocational resilience against AI displacement; fund reskilling for laid-off IT workers |
| Tax & Fiscal Reform | Broaden the direct tax base while easing the regressive burden of indirect taxation on essential consumer goods |
| Honest Statistics | Publish a bridge between the old and new GDP series, sector-level deflators and median wage and employment data every quarter |
Phase 3: Building Resilient Institutions for Future Generations
Competition Policy and the Risks of Excessive Market Concentration
| Reform | Details |
| Overhaul competition law | Prevent cross-sectoral conglomerate dominance |
| Market Concentration Monitor | With powers to break up monopolies/duopolies (telecom, ports, commodities) |
Strengthen Transparency, Accountability and Institutions
| Reform | Details |
| State Funding of Elections | Break the corporate-politician nexus |
| Wealth & Income Transparency Act | Mandate annual public disclosure of assets/incomes of all legislators and senior bureaucrats |
| Strengthen Local Governments | Decentralise 50% of all tax revenues to Urban Local Bodies and Panchayats for hyper-local development |
A New Social Contract for Inclusive Prosperity
| Reform | Details |
| Right to Economic Dignity | Legislate living wage, safe housing, clean water, clean energy, and digital access as legally enforceable rights—moving beyond discretionary welfare |
Beyond GDP: The Real Test of Economic Success
How to Interpret Economic Headlines and Statistical Limitations
| Common distortion | What to check |
| Confuses averages with medians | Celebrating average income rises while the median stagnates. Ask for median wages and incomes. |
| Uses flattering headlines | ‘Fastest-growing large economy’ can sit alongside weak job creation. Check employment and wages. |
| Relies on selective metrics | Core inflation can look benign while food inflation is high. Check the full CPI and the poor’s basket. |
| Conflates the stock market with the economy | A rising or falling Sensex does not measure prosperity for the large majority of Indians who own no shares. The index fell roughly 13–15% in 2026 even as GDP printed 7.8%. |
| Leaves gaps in uncomfortable data | Delays or revisions in consumption surveys and labour-force reports make trends harder to track. Ask for release dates and methodology. |
| Shifts attention | Debates about identity and rivalry can crowd out debates about jobs, prices and incomes. |
What Citizens, Business Leaders and Policymakers Can Do
Three Questions That Should Guide Public Accountability
- Education quality (not just enrolment)
- Employment generation (not just EPFO numbers)
- Livelihood dignity (not just GDP growth)
| Action | How |
| Audit with This Framework | Use the 5 parameters to ask tough questions |
| Demand Median Data | In every news piece, ask for the median wage, median farm income, median savings |
| Follow the Capital | Ask not just “what is GDP growth?” but “who owns the capital that is growing?” |
| Reject False Narratives | Challenge the “meritocratic” justification for billionaires when their wealth stems from land, resources, licenses, and inheritance |
| Hold Governments Accountable | Ask three questions—What is the education quality? What jobs were created? What livelihoods were protected? Accept nothing else as an answer |
As Piketty argues, inequality is shaped by political and institutional choices.
As Sen argues, development is freedom.
As Stiglitz warns, extreme inequality chokes growth itself.
As Rajan and other economists have cautioned, headline growth must be judged against investment, jobs and credible data.
As the exam halls of Bihar, Uttar Pradesh and Rajasthan show every year, the aspirations of this generation cannot be postponed indefinitely.
This action plan points towards an economy of broad-based opportunity rather than narrow concentration.
The choice is not between growth and equity; it is between durable, broad-based prosperity and a fragile, concentrated one.
The Future of India’s Economy Is Still a Choice
India’s economic future should not be judged by a single growth rate, a stock-market milestone or the fortunes of its wealthiest citizens. It should be judged by whether economic progress creates meaningful opportunities for the people who make that progress possible.
GDP growth matters. Investment matters. Infrastructure, innovation, entrepreneurship and global competitiveness matter. But their lasting value depends on whether they translate into productive employment, better wages, affordable essential services, stronger household savings and greater economic security.
That is the central lesson of this examination of India’s growth paradox.
The five-indicator framework offers a practical starting point: examine the quality of growth, the quality of employment, the purchasing power of households, the sustainability of public finances, and the productivity and innovation that create future opportunities.
These measures help move the conversation beyond competing political narratives towards questions that can be investigated, challenged and answered with evidence.
Are enough productive jobs being created for young Indians entering the workforce? Are real household incomes keeping pace with essential expenses? Can small businesses obtain the finance and capabilities they need to grow? Are education and healthcare expanding opportunity, or placing an unsustainable burden on families? Are public resources building long-term productive capacity?
These are not peripheral questions. They are central to whether economic growth can endure.
The reform agenda outlined in this article is ambitious, but its underlying objective is straightforward: build an economy in which enterprise and innovation create value, productive investment expands employment, education equips people for changing work, and institutions protect fair opportunity.
Achieving that objective requires careful measurement, transparent debate, sound policy and sustained implementation. It also requires intellectual honesty. Economic data must be interpreted in context, disputed claims must be identified as disputed, and policy proposals must be judged by their likely outcomes rather than their political appeal.
The question is no longer simply how fast India can grow. It is whether India can turn that growth into broader, more durable prosperity.
For citizens, the next step is to ask better questions and demand meaningful measures of progress. For business leaders, it is to invest in productivity, innovation, skills and employment pathways. For policymakers, it is to ensure that economic expansion builds opportunity and resilience—not just impressive aggregate numbers.
India’s potential is substantial. Realising it will require more than a strong headline. It will require an economy that works for a much broader share of its people.
Because the ultimate test of economic success is not just the wealth a country creates. It is the opportunity, security and dignity that its people can share.
Sources and Notes
Figures are as reported between 2 September and 13 October 2026; markets, interest rates and prices change daily. Please re-verify before relying on any figure. This article is general analysis for information only; nothing here is personalised investment, tax or legal advice.
- GDP and deflator: Policy Circle, 11 Sep 2026; Multibagg.ai, 2 Sep 2026 (statements by Jairam Ramesh, Yashwant Sinha, Raghuram Rajan, Arvind Subramanian and K.V. Subramanian as reported)
- RBI decision, 7 October 2026: Business Standard; Goodreturns (gold, silver, US yield, rupee)
- Oil, current account and reserves: HDFC Mutual Fund research note, 16 Sep 2026; Anand Rathi PMS, March 2026 (Hormuz and gas impact)
- Russian oil and US tariffs: Al Jazeera, 17 Sep 2026; India Defense News, 10 Oct 2026
- US Treasury yields: Wealth Professional, 30 Sep 2026; FXStreet, 13 May 2026
- FPI flows and market levels: Whalesbook, October 2026; Kotak Neo, 9 Oct 2026
- Jobs and AI: State of Working India 2026 (via Insights on India); Outlook India on IT-sector layoffs; Whalesbook on PLFS youth unemployment
- Manufacturing: Ideas for India: A net assessment of India’s manufacturing sector
- Fixed-deposit rates: SBI rate table via Paisabazaar (table dated 15 December 2025; may have changed after the RBI’s 7 October hike)
- Uday Kotak’s comparison: Investment Guru India, 3 Jun 2026
Subhashis Banerji [Author]
Leadership assessor, strategist, and writer. I help professionals and organizations make smarter decisions by learning to read patterns, not promises.
📘 Read all my articles here:
👉 https://successunlimited-mantra.net/ & https://successunlimited-mantra.com/index.php/blog PLUS on https://relationshipandhappiness.com/
💼 Connect with me on LinkedIn: https://www.linkedin.com/in/subhashis-banerji-21b1418/
No related posts.


– Please read our Comment Policy